Calculating Geospatial Socioeconomic Indicators for Healthcare with US Census Data
A number of healthcare metrics, including readmission rates and chronic disease burden, have been linked to socioeconomic indexes in various studies. In the United States, many of these indexes can be calculated from freely available US Census Bureau data. Generally, the index is a simple function of one or more census variables. For the years 2012–2016, we calculated a metric at the block group level from US Census data for the entire U.S. and territories. In addition to supplementing individual patient data to aid in diagnosis, this metric can also be used to enable visualizations about specific geographical areas to drive health care provider strategy.
While free, data for small area units such as the block group is typically only available for download in small chunks. This requires a somewhat tedious iteration over many downloads to build the large dataset that is required to make the calculations for the entire United States. Block groups typically describe populations of around 1500, but can range from a few hundred to a few thousand.
The Area Deprivation Index (ADI, Singh 2003) is one of a number of indices that can be calculated from US Census data. The ADI uses more census variables than any other index we have seen so far. The index itself is computed using a 1-factor factor analysis on 17 composite variables. These composite variables are themselves calculated from more than 50 census variables. The 17 represent meaningful concepts from four broad areas: poverty, housing, employment, and education. The 17 concepts and their categories are as follows (based on tables published in several articles):
| Category | Concept | Census Bureau ACS 5-year variable group |
| Poverty | Median family income | B19113 |
| Income disparity | B19001 | |
| % families below poverty level | B17010 | |
| % population below 150% of poverty level | C17002 | |
| % single parent households with dependents under 18 | B09002 | |
| % households without a motor vehicle | B25044 | |
| % households without a telephone | B25043 | |
| % occupied housing units without complete plumbing | B25016 | |
| Housing | % owner occupied housing units | B25003 |
| % households with more than 1 person per room | B25014 | |
| Median monthly mortgage | B25088 | |
| Median gross rent | B25064 | |
| Median home value | B25077 | |
| Employment | % employed person 16 or older in white collar jobs | C24010 |
| % civilian labor force unemployed (aged 16 or over) | B23025 | |
| Education | % of population aged 25 or older with no high school | B15003 |
| % of population aged 25 or older with at least a high school education | B15003 |
Using United States Census Bureau (CB) data, and closely following Singh’s method, but with some deviation, we have calculated the ADI at the block group level for the entire U.S. and territories for the years 2012–2016. This will be a valuable dataset to couple with individual patient records; however, useful spatio-temporal analysis can be performed with the ADI data itself. When coupled with block group population estimates, weighted distributions of ADI for aggregate areas (say city, county, or state) can be visualized and compared in order to identify areas that are at potentially greater risk of an adverse health outcome.
Methods
We obtained Census Bureau data from the 5-year American Community Survey (https://api.census.gov) for the years 2012–2016. The 5-year ACS estimates contain some missing data and some censored data. In most cases, we imputed these variables naively using the median of the valid values from the same year. Data for median family income for the years 2015 and 2016 was almost entirely missing due to changes in Census Bureau reporting rules, however; for those years, we substituted the values from the tract in which the block group was located. We could have used more sophisticated imputation methods, and may do so in the future, but these can be computationally expensive.
Rather than use previously published coefficients, we performed a factor analysis on the entire 5 year, 17 variable dataset. We felt that using the entire dataset in a single factor analysis was preferable to performing a factor analysis for each year, although this approach may not be sustainable if significant changes occur in the way census variables are measured and reported. However, during this 5 year period there were only minor changes. Following Singh, we scaled and shifted the factor values to have a mean of 100 and a standard deviation of 20.
Results
ADI maps for 2012 and 2016 are plotted in Figures 1 and 2. As they are largely similar, we don’t show plots for 2013–2015. The ADI in these plots is color-coded into five roughly equal bands, where dark red is the highest ADI (most deprived) and dark green is the lowest ADI (least deprived). The eastern seaboard is largely dark green, whereas the southeast and New Mexico show a lot of dark red. We can see that, for example, while deprivation increased in northern Alaska from 2012 to 2016, it decreased in southern Idaho in the same time period.
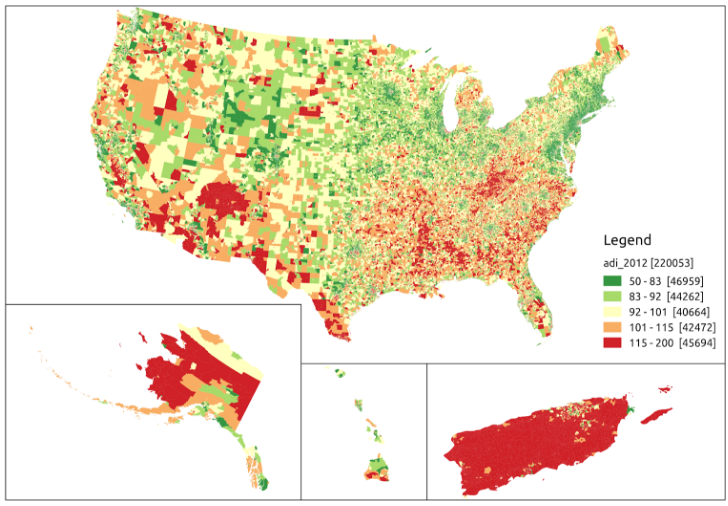
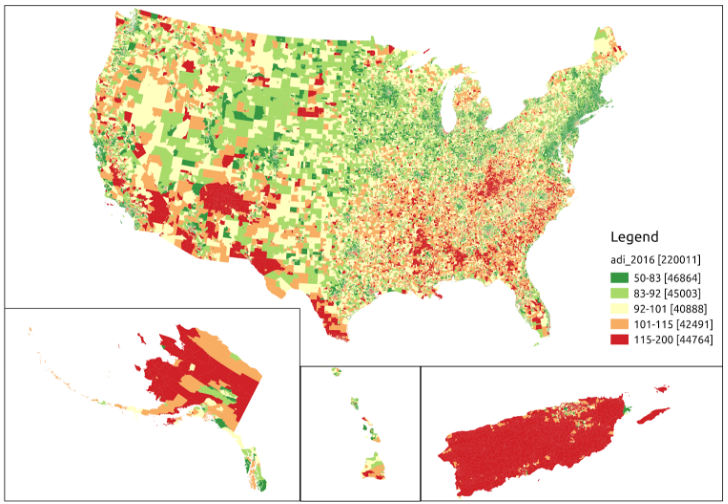
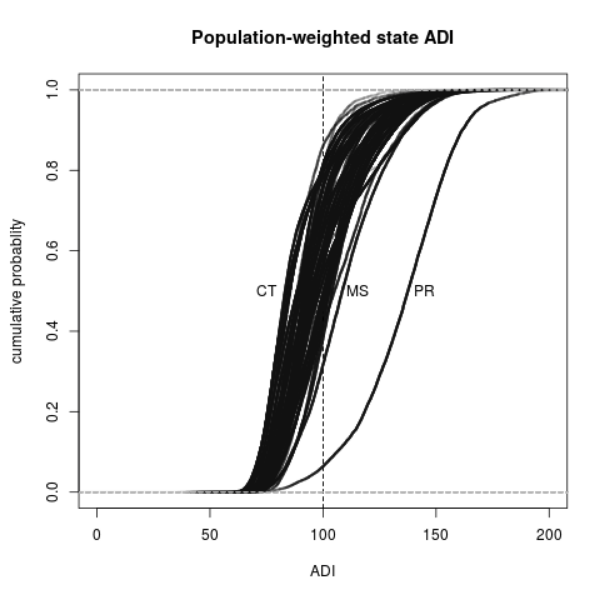
Figure 3 shows population-weighted cumulative distribution functions (CDFs) for each of the states and Puerto Rico. Puerto Rico lies far to the right of the other states, indicating the nearly island-wide level of deprivation in comparison. Among the states, Connecticut had the smallest median ADI (least deprived), while Mississippi had the highest median ADI (most deprived).
Discussion
Using the ADIs we have calculated, we can construct CDFs for any defined area as well as for any entity (such as a healthcare provider) with a defined client population, as long as that clientele can be geocoded to the census block group level and client addresses are current and valid. This could be useful for an entity who wants to assess its risk profile for those things that the ADI is associated with, or to assess the additional risk from expansion into new areas, acquisition of other healthcare providers, and so forth.
Having a stable ADI for a block group is important if it is going to be used to make decisions in real time, as the data behind the ADI are provided annually, in December of the following year. If the ADI were to change rapidly over time, the validity of its use in real-time decision making would be compromised.
Use of the ADI in healthcare analytics would be useful to payers and providers seeking to improve care, expand into new territory, understand their current risk profile (using their own patient addresses), or argue for higher reimbursement rates. The ADI would also be useful to care managers in post-discharge or transition scenarios.
Future work
- Improve the imputation of missing/censored values.
- Calculate additional indices that are based on census data, such as the Palmetto Small-Area Deprivation Index (Palmetto SADI).
- Calculate ADI for additional years. As the set of variables used was not measured consistently over time, other variables will need to be evaluated and compared. Developing models to construct a consistent index over time can also help.
- Perform trend analysis. Although there appears to be little overall change in the ADI from 2012 to 2016, there may be regions where significant changes took place. It would also be useful to quantify the distribution of block group level trends.
- Link the ADI to actual patient records, either at the individual or population level. For this we need sources of such data.
Contact us to learn more about how GA-CCRi can help you get the most out of public and private geospatial and healthcare data.