GeoMesa: Scaling up Geospatial Analysis
[Editor’s note: This article first appeared in the March 2014 LocationTech newsletter.]
GeoMesa is an open-source, LocationTech project that manages big geo-time data within the Accumulo key-value data store so that those data can be indexed and queried at scale effectively. Supporting the GeoTools API, and offering a GeoServer plug-in, GeoMesa aims to be easily accessible to a wide audience of developers already familiar with these platforms. The main ideas to understand as part of GeoMesa are: 1) it provides a very flexible way to linearize geo-time data so that they can be queried efficiently; 2) the data are distributed across the nodes in a cluster to exploit parallelism in computationally intensive queries to guard against hot-spotting; 3) the library supports open OGC APIs, making the transition from other databases to GeoMesa relatively painless.
This article describes how we took an interesting geo-time analysis, and scaled it up.
Indexing Geo-Time Data
Relational databases typically use some variety of R-tree for geo-spatial indexing, and then rely on a secondary index for time. In a NoSQL database such as Accumulo, all of the entries are stored lexicographically, meaning that indexing is a matter of choosing a good encoding for the data going in. Furthermore, there is no explicit support for secondary indexing, so the challenge becomes: How can you encode 2- or 3-dimensional data in a single string so that its ordering in a key-value table allows it to be queried efficiently?
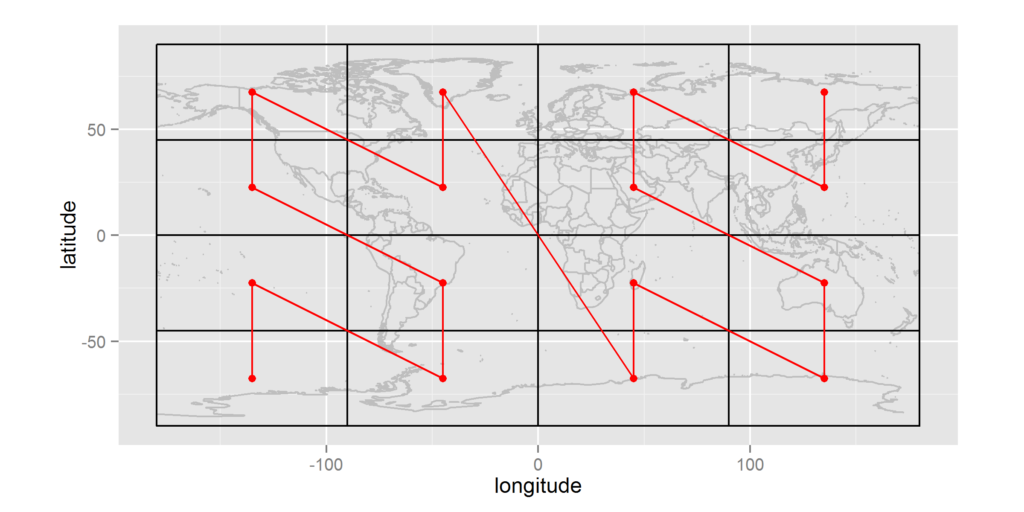
Space-filling curves address this need very well. A common example is the GeoHash, which uses interval halving on latitude and longitude to build up a bit-string of alternating dimensions: the first bit is a 0 or 1 denoting whether the point of interest is less than 0.0 degrees longitude or not; the second bit is for latitude; the third bit is for the second sub-division of longitude; etc. At four bits precision, this space-filling curve will divide the flattened globe into 16 separate regions, and the sequence of values from 0000 to 1111 will trace out a Z-order curve as shown in Figure 1. Planning a query is simply a matter of finding which subsets of the space-filling curve fall within the polygon of interest.
To accommodate time, GeoMesa supports a printf-style index schema-format that allows the user to define a custom space-filling curve by interleaving portions of the location’s GeoHash with portions of the date-string when expressed as YYYYMMDDHHmmSS. The index schema is customizable so that users can tune the structure to the resolution of their data. Storing data specific to a single city would likely benefit from a different schema-format than would global data. The default schema-format has been tuned to perform reasonably well on large, global data sets that we have ingested.
Partitioning and Striping
The space-filling curve has some draw-backs when used to index geo-time data, chief among which is its susceptibility to hot-spotting. A hot spot is a situation in which all of the data satisfying a given query are contained in a single node (in Accumulo, this means a tablet-server). To guard against this, GeoMesa index schema-formats default to pre-pending a partition or stripe number to the row key; this can be configured as part of the printf-like definition when the managed feature is first created. Figure 2 illustrates what events in San Francisco might look like when colored by their stripe numbers.
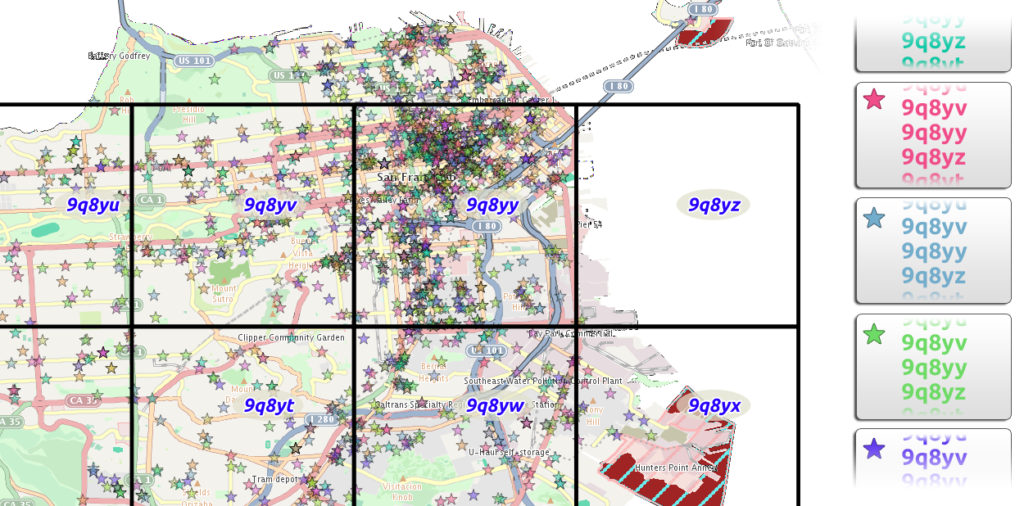
The advantage of striping is that the data, no matter their location or time, are spread uniformly across the nodes, so that any query for a non-trivial amount of data is federated out across many of the nodes. This prevents any single node from being over-tasked, and helps to balance the work-load across the cluster in the face of multiple queries, because a hundred incoming queries for the same data do not all have to wait for the same node to finish.
Open Source/Open APIs
It is important to GeoMesa not only to be open-source, but also to provide an easy on-ramp for new developers, and to be a good member of the community. Both of these goals are facilitated by supporting open geographic APIs; specifically:
- GeoMesa complies with the GeoTools’ API for data stores and simple features, meaning that any tools that already use these APIs can automatically transition to using GeoMesa with no more work than changing the parameters used to connect to a data store. Application developers are insulated from the details of the underlying datastore; they only need to code to the Geotools interfaces.
- GeoMesa queries support (E)CQL filters, meaning that not only can you select by location and time, but you can select data using complex expressions built from feature properties, boolean queries, and range queries. This is a huge benefit over creating yet another custom query language.
- GeoMesa ships with a plug-in for GeoServer that offers the ability to add vector layers to GeoServer that are managed by GeoMesa. This exposes GeoMesa-managed data via WFS (and by pass-through, WMS) opening up the data stored in Accumulo to many platforms that already speak WFS and WMS.
LocationTech provides the open-source governance, long term commitment, and engineering tools to not only build an open source system like GeoMesa but to sustain it over the long term.
Example Analysis: Animated GDELT Maps at Scale
The Global Data on Events, Language, and Tone (GDELT) is a collection of machine-curated data extracted from plain-text news stories. Going back to January of 1979, the dataset is updated daily, and contains more than 220 million individual records, each of which contains, among other data elements: a (point) location; date; and the type of event. We have ingested these data into a GeoMesa-managed table as a relatively small-scale test case.
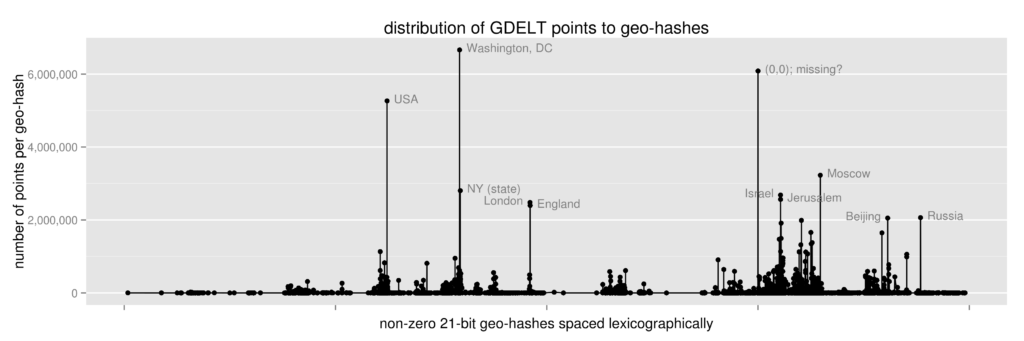
GDELT is interesting technically, because the data are significantly non-uniformly distributed, and that clumping — that can cause problems for some other indexing methods — does not impede GeoMesa queries. There are two main reasons why the data, as depicted in Figure 3, are so concentrated:
- Unbalanced action: Countries are significant actors, so any time that a government issues a statement or takes an action, the entire country is used as the location for the GDELT event.
- Data ambiguity: Geo-coding is imperfect, especially when the location is inferred from plain-text news items, so the second most popular location is (0, 0), which (presumably) is used when no other sensible location can be interpreted from the source document.
These two causes are shared by many other data sets. In fact, this “80%/20%” distribution of data elements to locations is fairly common (reference power-law and Pareto distributions).
In late July 2013, John Beieler — a Ph.D. student in Political Science at Penn State — published a map that shows protest events world-wide from January 1979 through June 2013. The map is animated, with each frame depicting a single month. (Protest events can be identified as having been tagged with a CAMEO code beginning with 14; see “Resources” at the end of this article for a reference to the coding system.) Though it was not made using GeoMesa in any way, Beier’s original map was engaging, and led us to wonder: If an animated map showing one slice of GDELT data over time is this engaging, what would it take to recreate the map using GeoMesa, and how easily could we create maps for all of the top-level CAMEO codes?
The tool-set we used for doing this included the following:
-
- GeoMesa: Data store and flexible query engine
- Twitter’s Scalding: using GeoMesa queries within map-reduce jobs to transform data and persist to HDFS
- Apache Spark: performed additional aggregation of data per location, time, CAMEO code
- R: served as our visualization engine, writing out individual frames in the animations
The entire stack of extractions, transformations, visualization, and packaging was completed in a single afternoon, yielding 20 animated GIFs totalling more than 354 megabytes. That so little time was needed to assemble these resources and execute the plan is a testament to the quality of the open-source tools in the chain mentioned above.
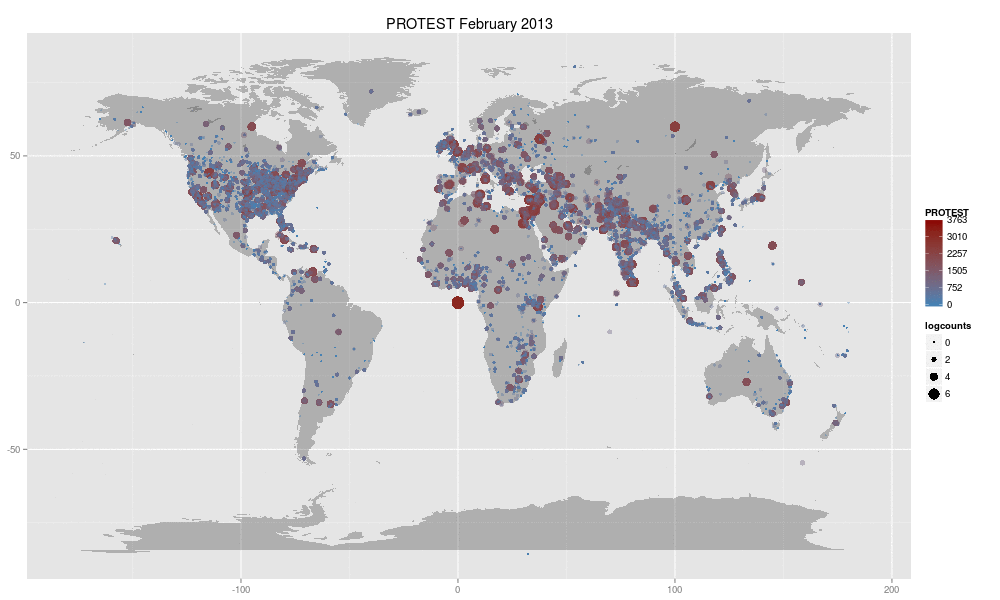
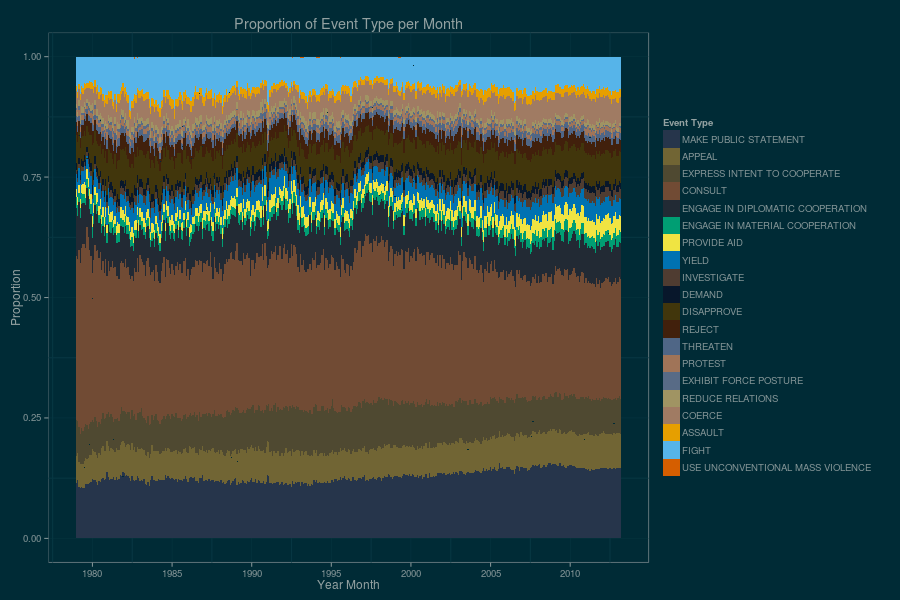
GeoMesa, with a collection of other open-source software packages, enabled us to recreate not only Beier’s original data visualization from more than 220 million GDELT data points, but to scale it up by a factor of 20 in a single afternoon. As so often happens, the most difficult part of the exercise was knowing when to stop: In addition to the sequence of animated GIFs, we produced an additional series of illustrations based on aggregations of these same base data. Figure 5 is one such example. The key take-away is that GeoMesa and its peers in the open-source processing chain allow us to focus on what is engaging in geospatial analysis.
Summary
GeoMesa, with a collection of other open-source software packages, enabled us to recreate not only Beier’s original data visualization from more than 220 million GDELT data points, but to scale it up by a factor of 20 in a single afternoon.
Resources
-
- Fox, Eichelberger, Hughes, and Lyon. (2013). Spatio-temporal Indexing in Non-relational Distributed Databases. Presented as part of the 2013 IEEE Big Data Conference.
- Leetaru, Kalev and Schrodt, Philip. (2013). GDELT: Global Data on Events, Language, and Tone, 1979-2012. International Studies Association Annual Conference, April 2013. San Diego, CA.
- Apache Spark
- Twitter Scalding
- GeoMesa
- John Beieler’s animated protest map based on GDELT data
- CartoDB and Torque
- Conflict and Mediation Event Observations (CAMEO) event codes
- Power-law and Pareto distributions
- R
- GeoHash