How Can SAR Imagery Improve on Optical Overhead Imagery?
Overhead imagery is widely used in a variety of applications, from monitoring natural disasters to visualizing directions on a map. For example, Google Earth uses overhead satellite imagery covering nearly the entire Earth’s surface. However, the satellite imagery most people think of isn’t the only kind available, and other types of overhead imagery have specific advantages for certain situations. This article covers some disadvantages of traditional overhead imagery, called electro-optical (EO) imagery. Then, we discuss Synthetic Aperture Radar (SAR) as an alternative that has important benefits for some use cases.
Electro-optical (EO) imagery uses light from the sun as illumination, like the main camera on an iPhone, which makes it easy to gather. Another key advantage is that it is intuitive to analyze, since EO sensors measure light in the visible spectrum, resulting in images that have familiar characteristics to the human eye.
However, this type of imagery has a few obvious drawbacks. Images taken at night won’t be very useful because there is no comprehensive light source. If there are light sources, like street lights or headlights, they tend not to illuminate very evenly, resulting in incomprehensible images. Another problem is that visible light doesn’t penetrate cloud cover, smog, or smoke very well, making the quality of images dependent on ambient weather conditions. This is a major problem for applications like tracking the spread of wildfires, which vary day-to-day and are obscured by smoke. If the object being imaged doesn’t move and if collection isn’t time-sensitive, then those problems can be somewhat mitigated; however, there are many applications that need high-quality, high-availability imaging. At GA-CCRi, several teams are interested in integrating satellite imagery with geospatial processing capabilities to create live and historical views of observed features. To address this goal we investigated alternative imagery types, principally SAR.
What is SAR?
SAR is a type of Side-Looking Aperture Radar (SLAR), which refers to an imaging system with these characteristics:
- Radar is used as active illumination. Waves are actively fired from a platform and measured by the sensor, as opposed to passive illumination, which uses an uncontrolled light source.
- The sensor is mounted on an airborne (or spaceborne) platform.
- The sensor is oriented so that it images from the side of the platform, as opposed to the front or back.
Why side-looking? Because SLAR is actively illuminating, the principal way it distinguishes between objects is by measuring the time it takes for a signal to return to the sensor. If the sensor were facing in the same direction as the platform it was traveling with, it would be unable to distinguish between two objects on either side of the sensor if each were equidistant to the sensor1.
A big problem with radar-based imaging systems is the resolution that can be obtained from a single image. Fortunately, SAR doesn’t just take one image; as the sensor moves across an area, it captures and stitches together many individual images. This lets it achieve a better image resolution synthetically. This is the main difference between SAR and its predecessor, Real Aperture Radar (RAR), which didn’t do any image combination; as a result, images taken using RAR are typically only used for applications where the object of interest is huge, like a landmass2.
Why is SAR Useful?
The basic characteristics of SAR make it useful in a broad range of environments. Since SAR uses active illumination, it can gather images at night or from areas with cloud cover, smoke, or smog obscuring the target area. For applications like land detection, biomass mapping, wildfire control, and urban planning, SAR has a comparative advantage over traditional EO imagery. Because multiple polarization combinations can be gathered at once, SAR image data can also be reused in different ways to reveal different objects of interest.
EO imagery is useful because it captures objects in the same way that we see them, making it easy to visually inspect images. SAR is useful because it interacts in different ways with objects of interest. Since SAR is actively illuminating, the imaging system can control how waves illuminate the target, which can give us more information than just detections of reflected waves from the ground. If the reflectivity of a material (the tendency to scatter waves back to a sensor) is known, then that information can be used with a SAR imaging system to discover additional information from an image. This is primarily done in two ways: Polarization SAR products and interferometry from complex SAR data.
Polarimetry (PolSAR)
The simplest way to use this characteristic of SAR systems is to control the polarization of the wave coming out of the sensor and filter which waves come back into it, measuring their intensity (amplitude). We call this polarization. Because this can be done for both outgoing and incoming waves, polarizations are typically expressed as pairs. For example, HH refers to a horizontally-polarized wave coming out of the sensor and a horizontally-polarized wave returning, while HV refers to a horizontally-polarized outgoing wave and a vertically-polarized incoming wave, and so on. SAR systems typically operate in one-, two-, or four-polarization “modes,” which refer to the combinations of the transmitted and received polarizations. The SAR imagery we’ve been analyzing at GA-CCRi is “quad-pol.” This means that it contains four polarizations, each of which is mapped to a channel in the image data: HH, HV, VH, and VV.
Why do we care about the polarizations of waves sent and received by the sensor? Because the intensity of those signals can tell us a lot about the composition of the area being imaged. For example, take a look at these images, which were collected over a region in Greenland from the Sentinel-1 SAR system (Miles et al)3, whose task was to monitor surface and subsurface lakes for drainage:
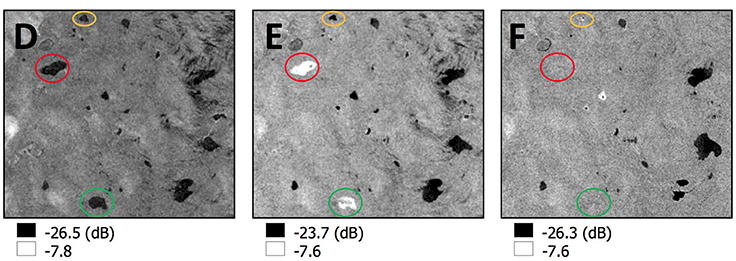
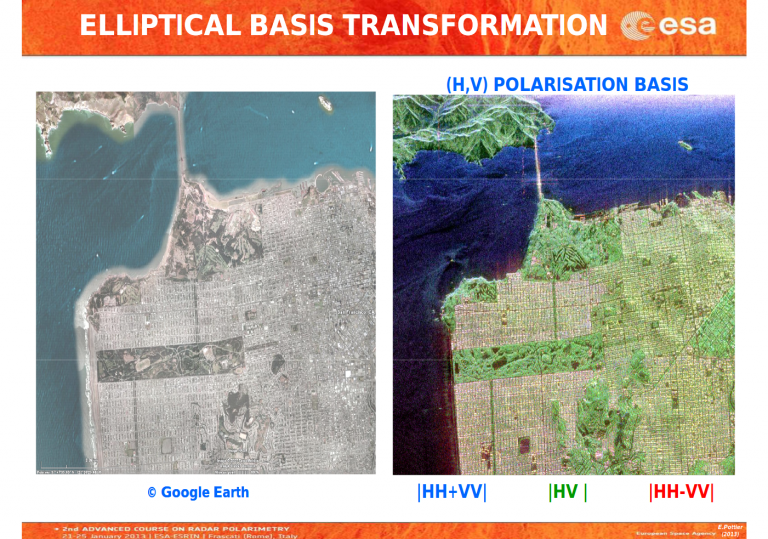
The research team exploited the differences in material composition of lakes versus dry land, which was reflected in the SAR imagery. Water tends to scatter comparatively little radiation back to an imaging sensor (called backscatter), which makes it distinct compared to land. Materials such as vegetation tend to backscatter more strongly, which distinguishes them in SAR imagery4. Using these characteristics, scientists can extract a lot of value from SAR imagery just by combining the polarization bands in different ways. This slide from Eric Pottier at the European Space Agency (ESA) shows another potential polarization pattern—one that produces a false-color RGB image that clearly identifies vegetation and urban layouts5:
Interferometry (InSAR)
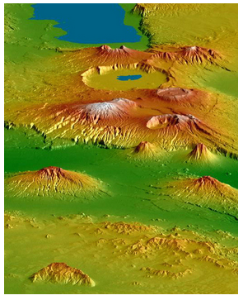
In addition to polarized intensity SAR data, an additional kind of SAR data can be taken: interferometric SAR data. Each element (pixel) is a complex number (a + bi) that contains both amplitude and phase information. Each particular pixel is of little use, though. The phase shift can be affected by the travel path of the wave, by objects the wave was backscattered from, or by the phase shift inherent in the lens6. However, if a second image is taken at roughly the same location, then we can compare the two phases. Since the phase shifts due to scattering from the object and the lens are the same for both images, any difference can be attributed to the travel path of the wave, which allows the distance between the two locations to be calculated. Interferometry is very useful for topological mapping because it doesn’t require many physical measurements to be taken, which can be difficult over remote or mountainous terrain.
Analyzing SAR Imagery for Machine Learning at GA-CCRi
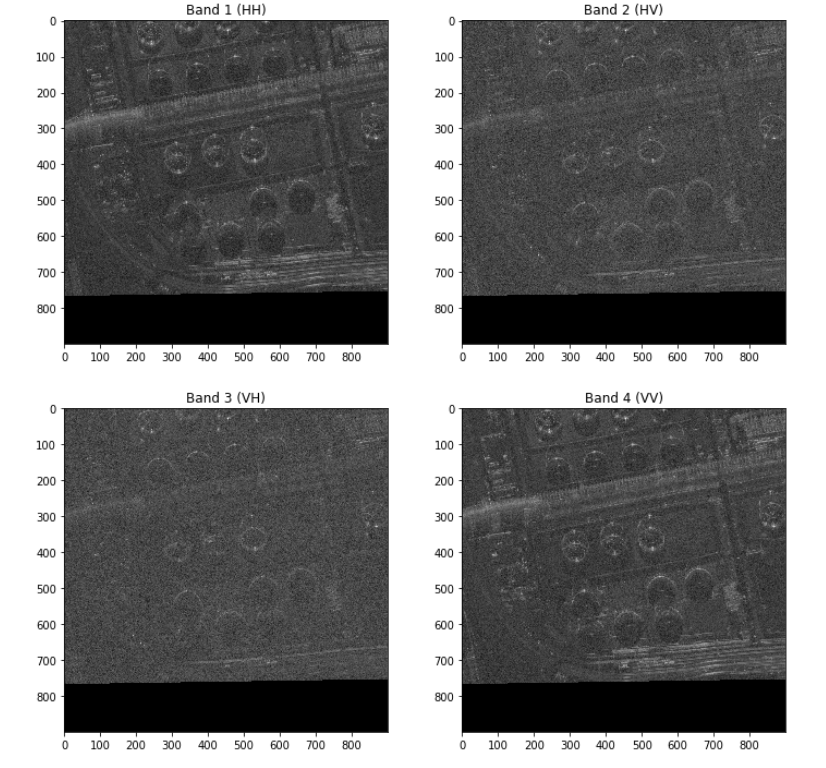
The work documented here mostly explores what we can do with SAR imagery. We have focused on manipulating SAR Intensity data to make image products available to our data scientists with the ultimate goal of using SAR imagery within GA-CCRi’s machine learning models. This has included actions such as support for image chipping, speckle removal, and the creation of false-color (RGB) image products. We have been using SAR Intensity data from the Spacenet 6 challenge, which used a SAR imaging system from Capella Space. Each image contains four channels, each representing a polarization pair, laid out as HH, HV, VH, VV. Below are images representing each of the four channels for the SN6_Train_AOI_11_Rotterdam_SAR-Intensity_20190823155824_20190823160121_tile_4540.tif image:
Working with SAR Imagery and the Volans Server
Volans is an internal GA-CCRi software package that enables many image processing functions. It lets users interact with elevation data, convert image coordinates to location coordinates, and provide streams of image chips for machine learning models. However, Volans lacked the ability to process SAR data due to the image data type and the number of bands associated with the test data set. (Previous Volans’ capabilities supported a maximum of 3-band imagery and we have since increased this to support an arbitrary number of channels.) With these changes implemented in our processing library, additional API capabilities were implemented that allow data scientists to directly interact with SAR imagery using our image processing interface: the Volans Server.
The Volans Server provides a language-agnostic way to access the image processing utilities in Volans using the Apache Arrow Flight protocol. Flight was the natural choice for the Volans Server because of its capacity for in-memory data structures that require no serialization or deserialization when sent over the wire using gRPC. Clients can use the Volans Server interactively through a Jupyter Notebook or programmatically from a containerized machine learning model, which enables a seamless transformation from model development to operating at scale. We primarily used the Volans Server for interactive exploration, though the groundwork has been laid for an at-scale SAR machine learning model to be developed in the future.
Removing Speckle
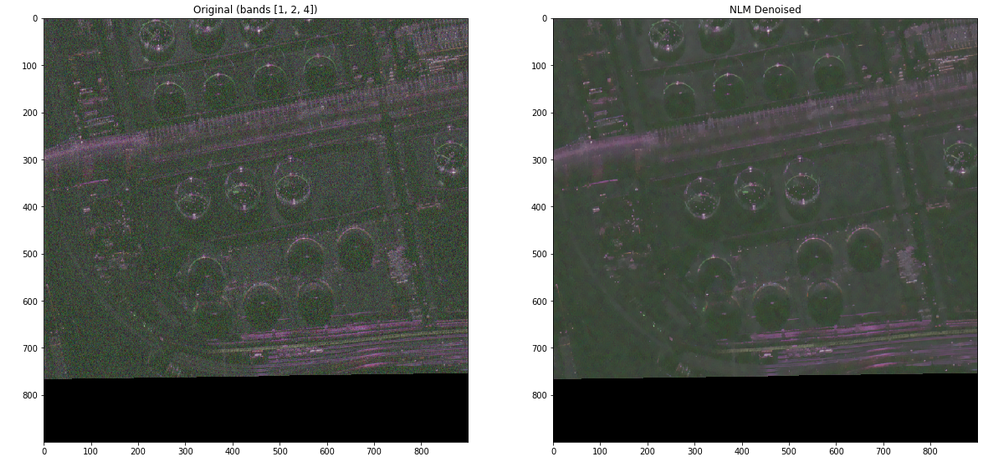
Speckle is a major phenomenon that reduces the resolution and clarity of SAR images. Removing it from images is necessary to create imagery that can be fed to machine learning models. Our investigation of SAR included an analysis of the best ways to easily reduce speckle in images while preserving image quality.
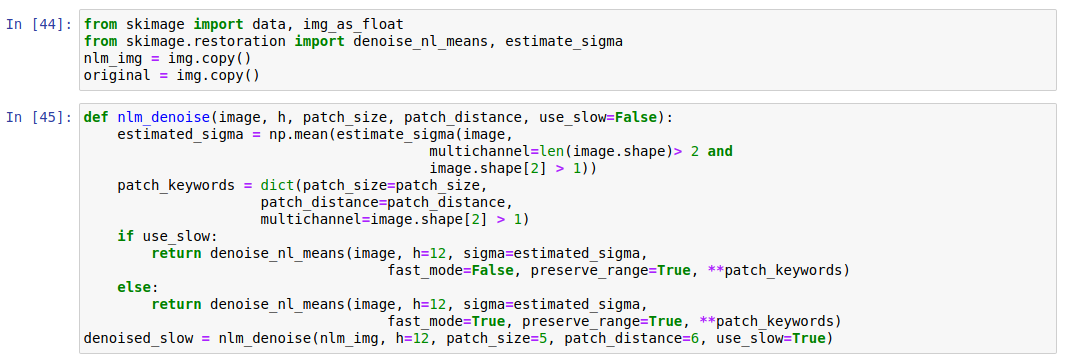
One promising despeckling algorithm we used is Non-Local Means denoising, which moves a ‘window’ over the image, averaging the values in the window to correct the value of the center pixel. This can reduce noise at the expense of image clarity, because sharp lines will be blurred, but with some parameter tuning we found it to be a good way to create images that were reasonably sharp and had improved noise characteristics. The following excerpt from our Python code shows how we used the denoise_nl_means function from the scikit library to accomplish this:
False-Color Image Products
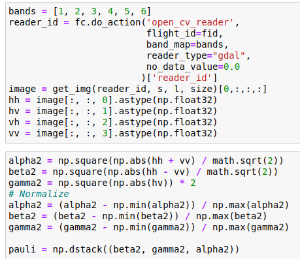
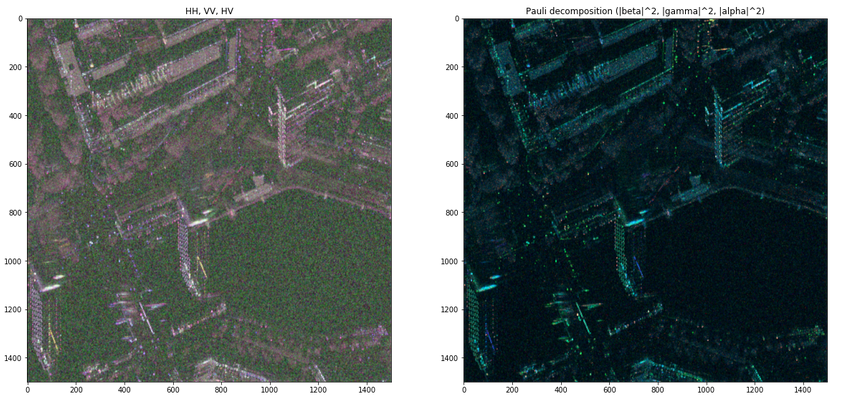
Another focus of our exploration was to find good ways to express SAR Intensity data as three-channel RGB images. There are many ways to do this, as documented in papers from the ESA and NASA, and we chose to pursue the Pauli Decomposition as an illustrative example. SAR decompositions do more than simply assign the polarization bands to the R, G, and B channels. They also express each channel as a combination of polarization bands, which creates an image that highlights specific phenomena in the image. Below is an example of a source image and its Pauli decomposition, which we implemented from scratch in a Jupyter Notebook:
Improving Volans Development Tooling
Updating the Volans image processing libraries was the first step in processing SAR imagery data, but the team also needed a way to inspect SAR data bands and rapidly iterate on the output. Below you can see an internal tool used for inspecting imagery within the Volans framework by allowing control of which data bands are displayed in either color or grayscale format. By default, Volans loads images for processing from shortest wavelength to longest, which may not yield the desired display of an image. Through various input parameters, a user can specify an initial band mapping that dictates the order in which image data channels are loaded and the GUI then maps these bands to color channels or displays a single band to produce a grayscale image. As previously mentioned, directly mapping a SAR data band to a color channel may not highlight geographic features adequately and future work would integrate decomposition capabilities.
GA-CCRi’s SAR Trajectory
The initial exploratory work demonstrated here barely scratches the surface of what is achievable when using this imagery type. Due to SAR’s unique properties, including weather-independent data collection and its ability to represent the reflective intensity of ground objects, the software developers and data scientists at GA-CCRi are excited to develop new machine learning models and build out image processing capabilities to use this rich image source.
References
1 http://www.csr.utexas.edu/projects/rs/whatissar/rar.html
2 http://www.geo.hunter.cuny.edu/terrain/radariii.html
3 https://www.frontiersin.org/articles/10.3389/feart.2017.00058/full
4 https://nisar.jpl.nasa.gov/mission/get-to-know-sar/polarimetry/
5 https://earth.esa.int/documents/10174/669747/PolSARBasic_Concepts.pdf
6 https://earth.esa.int/workshops/ers97/program-details/speeches/rocca-et-al/
7 https://nisar.jpl.nasa.gov/mission/get-to-know-sar/interferometry/
The Spacenet6 data used for this post is provided under the Creative Commons BY-Share Alike 4.0 License