Visualizing huge volumes of AIS data in a web-based map using GeoMesa and GeoServer
When starting a new data science project, one should typically first understand the problem domain, state a hypothesis, and then gather data to prove or disprove said hypothesis. But, if I’m being honest, I usually start with a new data set and ask “What kinds of problems can I solve with all this new data?!” I can’t help myself—a new data set is too intriguing to resist diving into. And the first thing I do when diving into new data is visualize it in as many interesting ways possible. For dynamic spatio-temporal IoT data, static visualization is not good enough—we need to animate this data over time to really get a sense of what’s going on. We can use GeoMesa, a suite of tools for managing and analyzing spatio-temporal data, in combination with GeoServer, an extensible OGC service provider, and GA-CCRi’s Stealth, a web-based mapping client capable of animating millions of spatio-temporal records in vanilla JavaScript with no WebGL required.
I analyzed a large volume of AIS data—the Automated Identification System used to track and identify ships. All ships broadcast their location and identity over AIS to other nearby ships and to AIS receivers. In the data that I have, there’s about 6 million observations per day with information regarding the time and location of the observation, the ship name and MMSI, and some fields about navigational status. That’s about 2.1 billion records a year and from what I understand, that’s a relatively small set of AIS data. Some satellite collected AIS data sets are an order of magnitude larger than that.
Ingesting the data into GeoMesa involves developing a mapping from raw AIS records to OGC SimpleFeatureTypes. Since AIS comes in a binary form, I pre-processed the data into CSVs using some off the shelf tools like libais and gpsdecode, the latter available on Ubuntu as a pre-built binary package. Once the data in a CSV form, I can use GeoMesa’s configurable delimited text converter to map the data into a SimpleFeature. Several ready-made examples of data model mappings can be found in the GeoMesa Github repository.
At this point, we have more than 2B records in our database ready to be sliced and diced. In the following screenshot, you can see the actual volume of the data when we render each AIS observation independently.
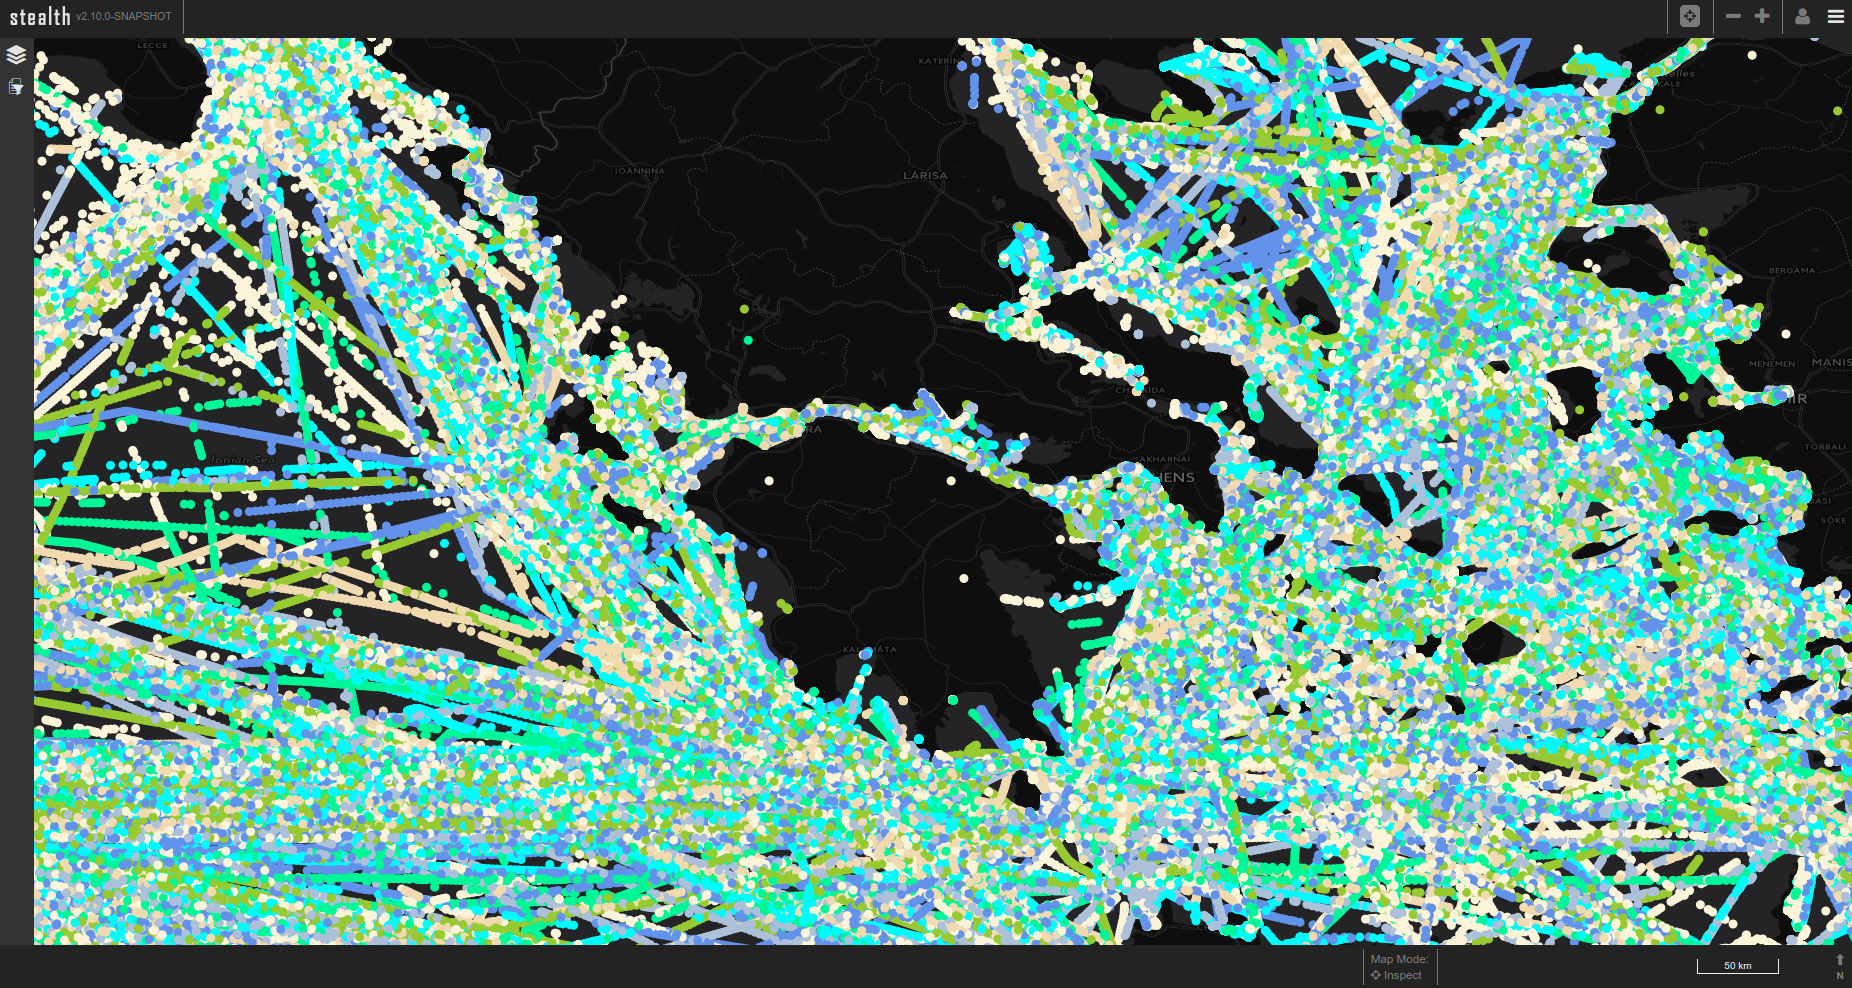
That’s not terribly useful. An aggregate heatmap is more useful at this scale of data.
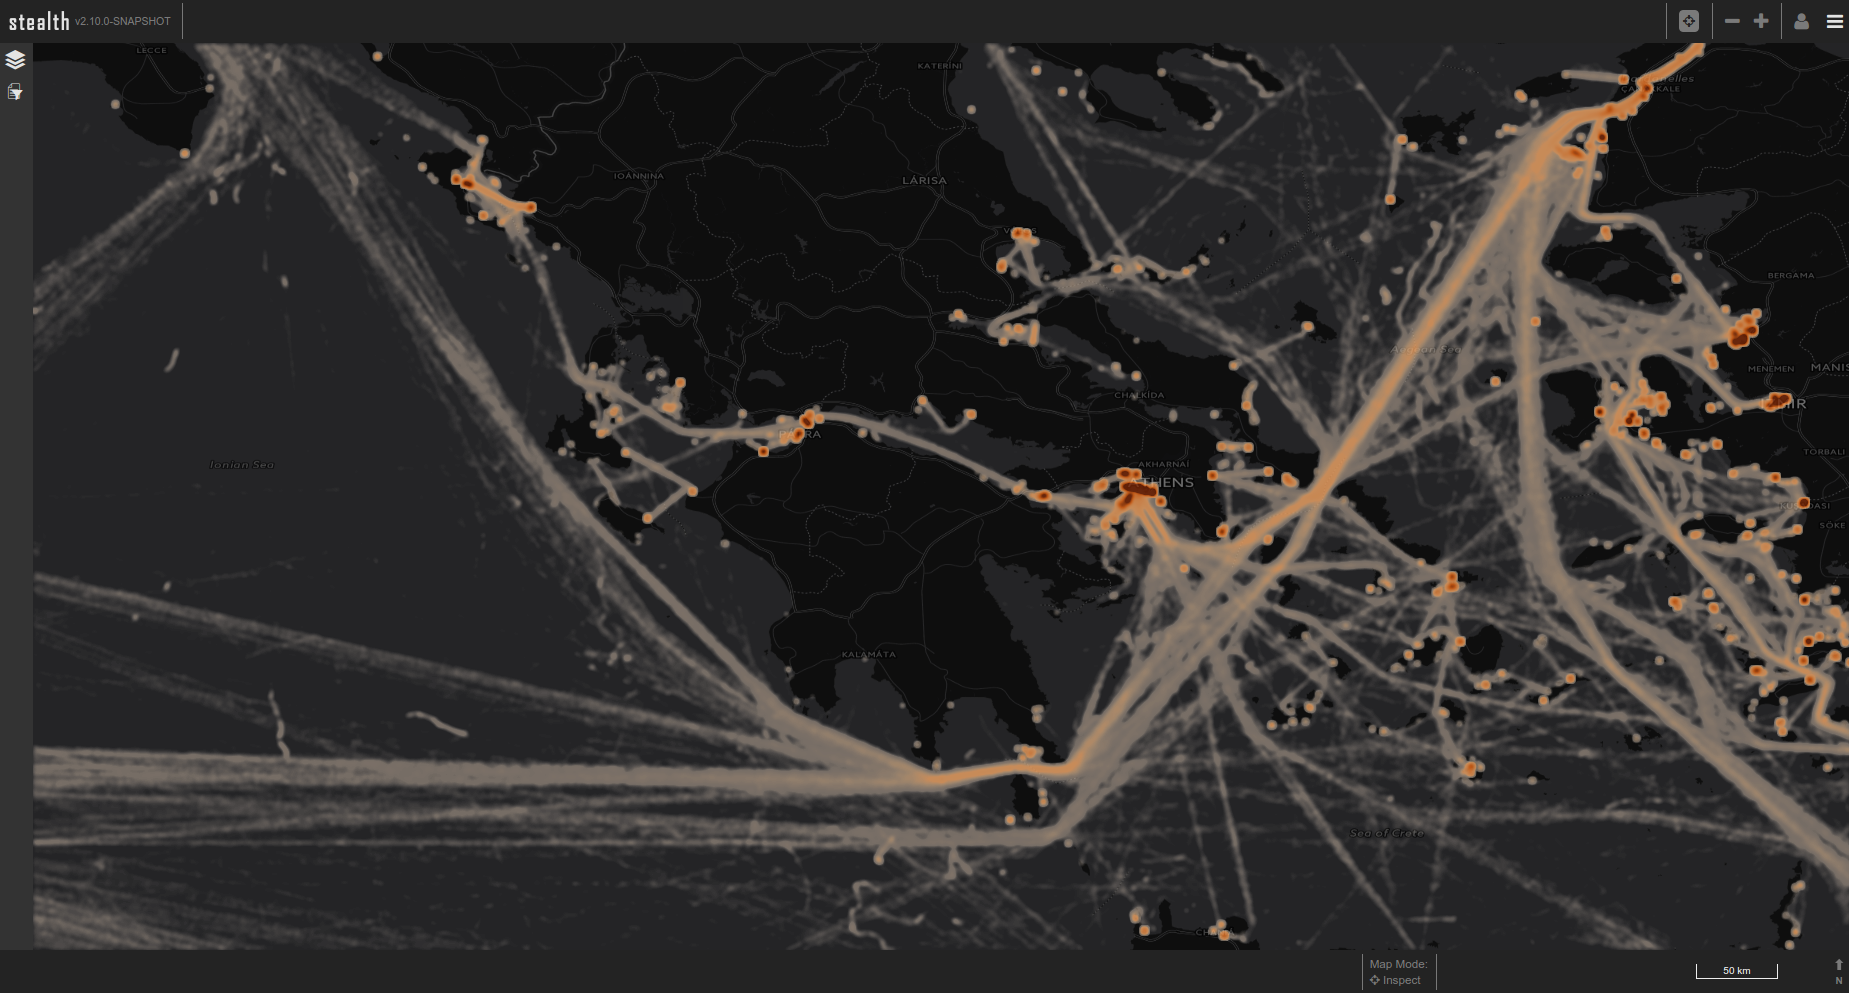
Now we can start to see transit lanes and other larger patterns in the data. There’s a lot of ship traffic in the Mediterranean. We can also use GeoMesa’s Web Processing Service (WPS) tools to visualize histograms of various attributes. In Stealth, we have wired this into a visual control that allows a user to drag a box and compare attribute counts in different spatial regions.
While this is getting better, the best way to get a sense of this dynamic data set is to animate it. This is where GeoServer comes in. GeoServer is a very capable OGC service provider in its own right but its real power comes in its extensibility. You can plug in different data stores. GeoMesa has several custom data stores such as the AccumuloDataStore for high volume historical data and the KafkaDataStore and StreamDataStore for streaming real-time visualization. I dropped the AccumuloDataStore into my GeoServer deploy for this analysis.
GeoServer also has extensible MIME types. This lets you develop a vendor-specific MIME type and request data encoded with that MIME type over OGC standards like WFS. We have developed a compact binary representation of spatio-temporal records as a MIME type. It works by intercepting the WFS request and configuring the subsequent usage of the GeoMesa API with a hint describing the request as a binary request. GeoMesa then configures its parallel database scans to transform the data into the compact representation inside the database, thereby greatly reducing the amount of data that needs to ship across any of the network links. Any OGC compliant client can make WFS requests against GeoServer and specify the binary output format. If the client understands the format, it can render it. GA-CCRi’s Stealth web mapping client understands this format and makes extensive use of Javascript’s typed array buffers to achieve high performance when rendering millions of points. By sorting and laying out the data in an optimal memory pattern, Stealth can rifle through the data and paint frames on an HTML canvas very rapidly.
The following screen capture demonstrates the power of this visualization. Several million records are packed into an efficient binary format by GeoMesa in response to a WFS request with the appropriate MIME type. The time slider shows a histogram of counts over the query range. The window of data shown on the map is controlled by adjusting the window within the time slider. The time slider histogram is dynamic. When you zoom in, it adjusts the histogram to just what is shown in the viewport. This is possible because all rendering is done client side—both the trajectories on the map and the histogram. And, the animation can either be played back using the control on the far right or dragged by grabbing the window. You can really begin to see patterns when you watch the trajectories evolve over time. Merchant vessels travel along the transit routes while other vessels have more ad-hoc patterns outside of the transit lanes.